
By Robin Whittle
Introduction. This article describes an investigation concerning the maintenance of the river wall to Flood Cell 01. This has led to an understanding of how the raising of any river wall in the estuary will affect the possible flooding of other flood cells. The work has resulted in providing the landowners with the results and a proposal for a protocol for the maintenance of the river walls.
Figure 1 (taken from the Deben Estuary Plan, 20151) shows the topography of the flood cells.
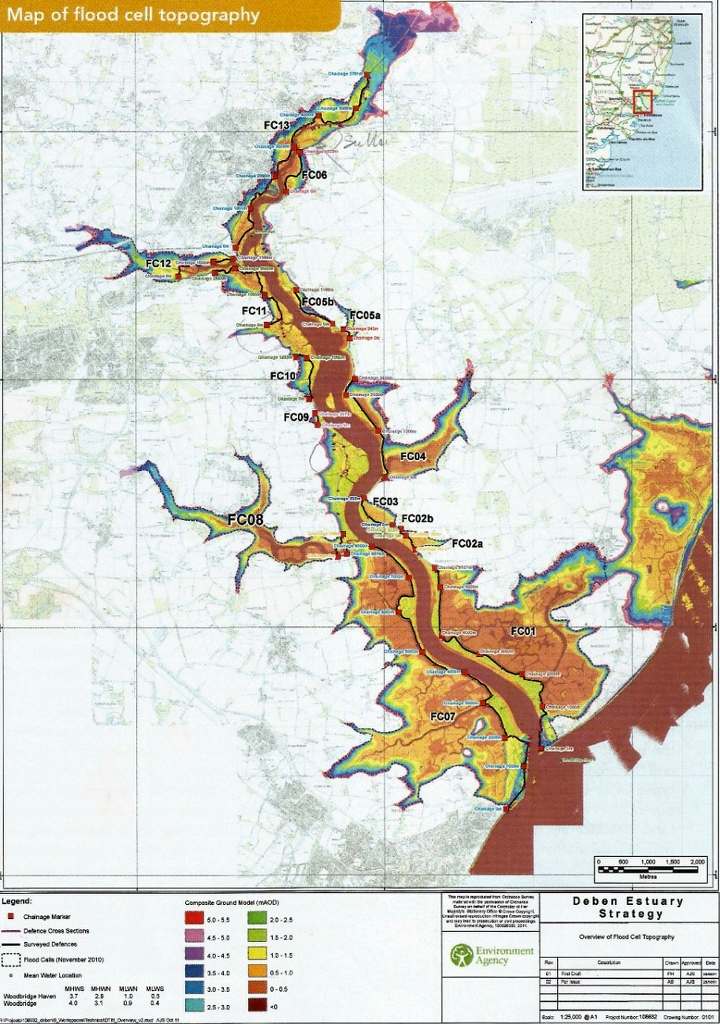
Figure 1: Topography of the flood cells
Since the surge of December 2013 there has been much activity to raise the river walls of the Deben Estuary. Table 1 shows the level to which the walls have been raised.
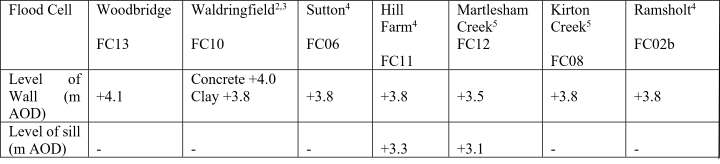
Table 1: The level to which the river walls have been raised
At the time of writing the river walls to Bawdsey Marshes (FC01) and Shottisham Marsh (FC04) are planned to be maintained but work has not started.
The river wall for Flood Cell 01 is about 5km long and protects over 500 Hectares of arable land.
The main reason for having the river walls with regard to farming crops is to prevent the flood cell from flooding since sea water would destroy the crops and prevent replanting for at least two years. I understand that the gross revenue for the crops in FC01 is around £1,200/hectare/year (£600,000/year).
Although the EA has no legal obligation to protect land from flooding it has permissive powers to build and maintain river walls for which the government provides funding via the Flood Defence Grant Aid (FDGiA). This prioritises the protection of homes (not just Woodbridge). Legally, any engineering activity on a flood defence would need to prove that the works do not increase the flood risk to anywhere else before a Flood Risk Activity Permit can be issued. If the walls are levelled up, then this is a simple task. If the walls are raised it may be that modelling is required to prove flood risk is not increased.
The level to which the walls are raised could affect other parts of the river and the EA keeps a close eye on each project to ensure that unacceptable flooding does not occur to other flood cells and that the tidal prism remains stable (the tidal prism is the amount of water that flows into and out of the estuary with the flood and ebb tides). Any plans which significantly altered the tidal prism could have a disastrous effect on the flood defences for the Felixstowe Ferry, Waldringfield and Woodbridge. This underlines the importance of retaining protection to Flood Cells 01 and 07. The present level of the river wall for FC07 does not require any immediate maintenance as it was brought up to a height of about +4m above Ordnance Datum (AOD) in the late 1950s.
How high is it permitted to raise a river wall?’ Currently it is likely that the EA would permit walls to be maintained to the height to which they were last raised. Raising it to a higher level is likely to require further model analysis.
I spent some time in locating the construction drawings for the river walls. Figure 2 shows the construction drawings for FC01 river wall dated 1949, built to a height of +3.7m AOD.
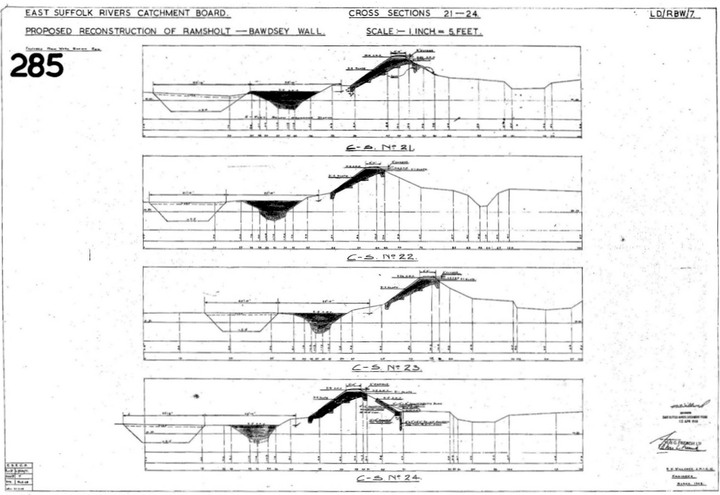
Figure 2: Construction drawings for river wall between Ramsholt and Bawdsey
The discussion, concerning the work on the river wall protecting Flood Cell 01, was being considered early in 2020. There were two proposals being considered at that time:
Scheme A was put forward by Hawes Associates (HA). This proposal raises half the 5Km wall, currently lying below +3.3m AOD to +3.8m AOD. The remaining half, that lies between +3.3mAOD and 3.5m AOD, remains unraised but covered with steel mesh and anchors (turf reinforcement). Turf reinforcement enables the wall to survive a higher depth of overtopping without breaching than a grass covered clay wall.
For those parts where ‘conventional crest raising’ was specified, the work included – (i) removing topsoil, (ii) excavating clay from existing borrow ditch, (iii) building up the wall on the land side from the toe upwards (with a slope of 1:3) until the top is at a level of +3.8m AOD and 1.5m wide, (iv) replacing topsoil (see Figure 3).

Figure 3: Raising low parts of the river wall
For those parts where ‘reinforcing turf with mesh and anchors’ was specified the work included – (i) cutting the grass very short on the landward bank, (ii) laying galvanised UPVC coated mesh and anchor in trenches top and bottom, (iii) installing mechanical anchors, (iv) marking all treated areas with steel posts at toe of landward bank (see Figure 4). Special protection is required at the interface with the surface just covered with grass to prevent scouring of the clay wall at times of over-topping.

Figure 4: Adding reinforced turf with mesh and anchors
The estimated cost for this work in 2015 totalled just over £450k.
There is concern that raising the height of the wall at a future date to combat sea level rise would require the existing reinforcing mesh to be removed, since it would not be a suitable surface on which to lay more clay. However, it has been proposed that rather than removing the old mesh it may be possible to hold the new clay in place by attaching 6 x 2.5 km x 1m mesh strips to the old mesh – but it would be costly.
Scheme B was put forward by the Water Management Alliance (WMA) (supported by the Inland Drainage Board (IDB)). This scheme increases the clay wall height to a constant level of +3.8m AOD throughout its length, without the use of reinforced turf. The plan assumes a 3m crest width and ‘conventional crest raising’ for the full length of wall. The WMA considers it is important to ensure that heavy equipment can reach any point along the top of the wall where a breach might occur. It would also allow access to the riverside face of the wall. Such equipment will require a 3m width of crest.
The estimated cost of this work in 2020 totalled £1.5M
My assessment: In summary each scheme would provide a robust wall and prevent breaching for the next fifty years. Breaching of a clay wall is where a whole section of the wall has been washed away and is much more serious than just over-topping. A grass covered wall would be expected to survive overtopping to a depth of 200mm. Scheme A appears to be a third of the cost of Scheme B. However, Scheme A leaves half the length of wall at its current level, between +3.3m and +3.5m AOD. This part of the wall will act as a sill and increase the risk of flooding. The risk of flooding (overtopping) for Scheme B with a wall height at+3.8m AOD in 2070 is 1in 60 years. The risk of flooding for Scheme A, with a wall height at +3.3m AOD, is 1 in 8 years.
In order to calculate these results, it was necessary to understand how the surges/storms affected the estuary.
The tide level and storm surge predictions are provided by the East Anglian Coastal Modelling Study produced by JBA Consulting. This is based on the EA 2015 Model: National Planning Policy Framework Climate Change Guidance (UKCP09)7. It has provided reasonably accurate results, close to the actual values occurring in the 2013 flood. The level of the surge in the Deben reached +3.4m AOD throughout its length (Woodbridge to Felixstowe Ferry – measurements taken by Richard Steward).
A worrying diversion to the investigation occurred when I received an email from Andrew Hawes in March 2020, which he had received from the EA. This included results of the surge model that appeared to reduce the surge heights for Flood Cell 01 by over 300mm from the levels that he had considered when carrying out the design for Scheme A. My colleague, Richard Steward, pointed out that the analysis had been carried out for the ‘undefended’ state. JBA Consulting confirmed the reason for the discrepancy between these values and the values provided in a spreadsheet for Coastal Boundary levels (from Lowestoft to Harwich). The relevant table for the Deben Estuary should have been for the ‘Defended’ situation with the river walls in place. The values that had been given to Andrew Hawes were for the situation with the river walls removed.
To avoid flooding the best solution for the landowners of FC01 would be to provide a constant wall height. After some discussion with a representative of the EA it became apparent that to raise the wall to a level of +3.7m AOD or above would require some form of analysis to demonstrate that raising it would not cause flooding of other flood cells during a surge. In order to check the risk of flooding of FC01 I commissioned JBA Consulting to run the surge model with the existing heights of the flood cell walls except for FC01 for which the wall height level should be set at +3.7m AOD. On 18th August 2020 JBA Consulting sent me an amended table showing the surge values for this situation based on data from 2015. This is a new analysis for which I paid £900. To determine the risk of flooding in 2070 (50 year on) it is necessary to take account of sea level rise and settlement of the walls. The calculations carried out are for the highest surge point along FC01 wall at a chainage of 4,800 from the estuary end of the river. The surge value for this chainage in 2015 is +3.52m AOD.
The effect of sea level rise. Mean sea level rise, UK (Absolute) MSL, has been determined by the National Oceanographic Centre (https://www.theccc.org.uk/publication/managing-the-coast-in-a-changing-climate/ Figure 2.2 on page 24) and is currently 1.4mm/yr. To this is added the East Coast Isostatic Land Subsidence currently 1.5mm/yr, and the tidal range increment of 0.6mm/year. This totals 3.5mm/year.
Using this value, the effect of sea level rise from 2015 to 2070 (55years) is predicted to be 55 x 3.5 = 193mm for the year 2070.
Allowance for further settlement. After some consultation, a value for settlement of 2.5mm/yr has been taken. Hence the settlement between 2020 and 2070 is 50 x 2.5 = 125mm for the year 2070.
At chainage 4,800m, the wall height required in 2020 to avoid flooding in 2070 from a 1:75 event would be 3.52 + 0.193 + 0.125 = +3.83m AOD.
Checking the risk of flooding: Using the data from the model sent to me by JBA Consultants it has been possible to check the risk of flooding. The information in Figure 5 is taken from the model and shows the necessary height of wall in m AOD to prevent overtopping for a given risk from a surge in 2015 at a chainage of 4,800. Table 2 shows the flood risk for 2020 and 2070 (when the next maintenance work should take place) for particular level of the top of FC01 wall. To eliminate a flood risk to this flood cell for a 1:75 year event, the wall height would require to be designed to a level of +3.83m AOD. It should be noted that if a higher value than 3.5mm/year were to be used for SLR then the risk of flooding would rise.
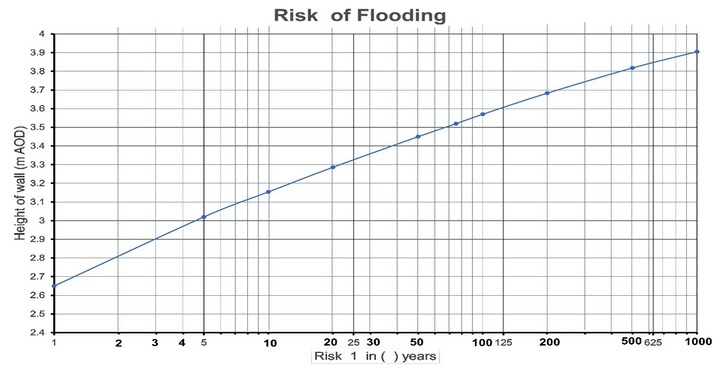
Figure 5: Height of wall to prevent overtopping for a given risk from a surge in 2015
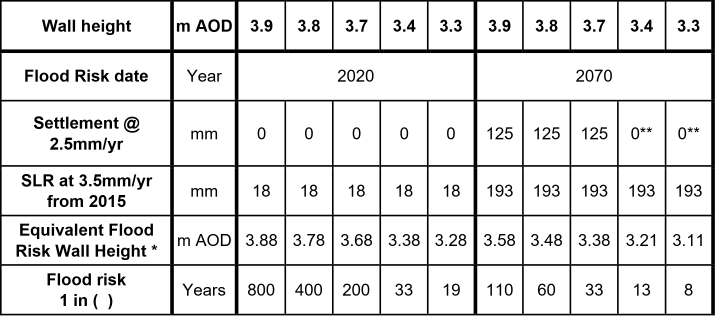
Table 2: Flood risk for Flood Cell 01 for 2020 and 2070
* This is the equivalent surge value for chainage 4,800 that is used in the model results table to obtain the relevant flood risk value.
** Zero settlement is assumed where turf reinforcement has been used
Planning for the future: It would appear sensible to set up a protocol to maintain the clay river walls of the Suffolk estuaries, at 50-year intervals. The following has been drafted by Richard Steward and myself.
Most of our Suffolk estuary river walls were built some 500 years ago to provide grazing marsh and arable land. Over this time the walls have been raised by about 600mm/century by the landowners and local community to offset sea level rise (350mm/century) and settlement (250mm/century). Between 1930 until 1996 this work has been carried out by the River Catchment Boards, Regional Water Authorities, National Rivers Authority. Since 1996 the responsibility has been with the Environment Agency (EA).
The EA is responsible for protecting urban areas (land with dwellings) but following a government imposed eight-fold increase in the EA’s benefit cost ratio, the responsibility for maintenance of many river walls has been passed back to the landowners/community. During the last ten years local estuary plans have been produced by Estuary Partnerships representing the community, landowners and local Government bodies. However, despite many years of meetings and discussions, there has never been an agreed protocol for determining the height and specification of the river walls.
The following is a proposed solution using observed data that can be applied to all east coast estuaries:
- Ideally a common model should be used for all the Suffolk estuaries. The most appropriate would be the East Anglian Coastal Modelling Study, currently used by the EA. It is proposed that the measured ‘debris line’ level at the river entrance from the 2013 storm surge should be used as the datum for future maintenance. Blyth 3.0mOD, Alde & Ore 3.3mOD and Deben 3.4mOD.
- The ‘Rebuild Period’ should be 50 years.
- Add 6mm per ‘Rebuild Period’ year to compensate for SLR and wall settlement – 50yrs x 6 =
- Add 200mm where there are no saltings in front of the wall.
- Add 300m where the wall directly protects property.
- Flood Cell rebuilding order of priority. 1) Protection of lives, 2) Protection of property by value, 3) Protection of land by value.
Note: There has been much speculation regarding an acceleration in sea level rise. Currently, none of the world’s tide gauges show a discernible acceleration during the past 150 years. The following link show the latest information in Figure 2 on Page 24, https://www.theccc.org.uk/publication/managing-the-coast-in-a-changing-climate/
See also the 168 year tide gauge record at Wismar, Germany, 149 years at Aberdeen and 124 years at Fort Denison, Australia.
https://tidesandcurrents.noaa.gov/sltrends/sltrends_station.shtml?id=120-022
https://tidesandcurrents.noaa.gov/sltrends/sltrends_station.shtml?id=170-011
https://tidesandcurrents.noaa.gov/sltrends/sltrends_station.shtml?id=680-140
In the Met Office’s UKCP188, the closest projection to current East Coast SLR is the 5th Percentile of RCP4.5. This projection shows a small acceleration of 18mm by 2070 which, for a ‘Rebuild Period’ of 50 years, has no significant effect on wall height.
Robin Whittle
Robin Whittle is a civil engineer who worked on power stations and dams in his early working life. In 1968 he joined Ove Arup and Partners and since then has provided specialist advice for reinforced, pre-stressed concrete and structural design from within Arup Research and Development. He retired in 2001, although continuing work as a Consultant. His main pastime pursuits have centred around sailing and, in the latter years pottery, with his own studio. He enjoyed many years sailing 505 dinghies and attended championships all over the world. In the mid-nineties his wife Gillie declared that dinghy sailing was at an end for her. Together they chose a more relaxed boat, the Cornish Shrimper, in which they could explore coastal waters. He is a member of the Felixstowe Ferry and Waldringfield Sailing Clubs.
References
- Deben Estuary Partnership: The Deben Estuary Plan: April 2015:
- Whittle R: Work on the river defence at Waldringfield: Phase 1: The Deben No. 50 Spring 2015
- Whittle R: Work on the river defence at Waldringfield: Phase 2: The Deben No. 53 Autumn 2015
- Whittle R: Repair work to the river walls of the Deben following the tidal surge of December 2013: The Deben No. 49 Autumn 2014
- Whittle R: Repair work to the river walls at Kirton Creek and on the north side of Martlesham Creek: The Deben No. 51 Autumn 2015
- Environment Agency: Flood Risk Activity Permit : June 2019
- Environment Agency: Flood risk assessments: climate change allowances: July 2021
- Met Office: UK Climate Change Projections: 2018